Insight
Jun 08, 2026 · 8 min readChick-fil-A's $9-million stores: what a private giant's franchise filings reveal — and what they don't
Scale basissystemwide sales (USD)· 2025 · source-backed via FDD (S2)
Every public operator in this series files audited SEC statements. Chick-fil-A — privately held by the Cathy family — does not. But "no SEC filing" is not the same as "no data," and that distinction is the whole caliber lesson of this brief. Chick-fil-A is a franchisor, so it must publish Franchise Disclosure Documents, and those FDDs report real, reviewed figures: U.S. systemwide sales of roughly $23.9 billion in 2025, and per-restaurant volumes that are the envy of the industry. Those numbers are source-backed — drawn from an official document — just held at a lower tier (S2) than a public company's audited 10-K (S1).
What the FDD does not contain is the rest of a normal financial picture: no company-level revenue, profit, or margins, and — because there is no public stock — no market capitalization. So the honest job here is not to call everything an estimate; it is to source what is sourceable at the right tier, and refuse to invent the company-level lines that genuinely don't exist. Get that right, and the headline fact stands on solid ground: a standalone Chick-fil-A does about $9 million a year — the densest box in American fast food — while closed on Sundays.
What the filings do reveal
From the FDDs and Chick-fil-A's own disclosures, the system-level picture is firm: roughly $23.9 billion in U.S. systemwide sales in 2025 (up from about $21.6 billion in 2023 and $22.7 billion in 2024), across 3,287 restaurants (total network, incl. licensed) — enough to rank third in U.S. fast food by sales behind only McDonald's (opens in new tab) and Starbucks, on a fraction of their footprints. These are reported figures, not guesses; FoodBud tiers them S2 (FDD-sourced) rather than S1 (SEC-audited) to signal that they come from franchise filings, not a 10-K — a difference in authority, not in whether the number is real.
The boundary is just as important as the data. Anyone quoting a precise Chick-fil-A "net income," "operating margin," or "enterprise value" is extrapolating beyond what is disclosed — those lines are not public, and FoodBud does not manufacture them. The discipline is to publish the sourced system metrics, label their tier honestly, and stop at the edge of disclosure.
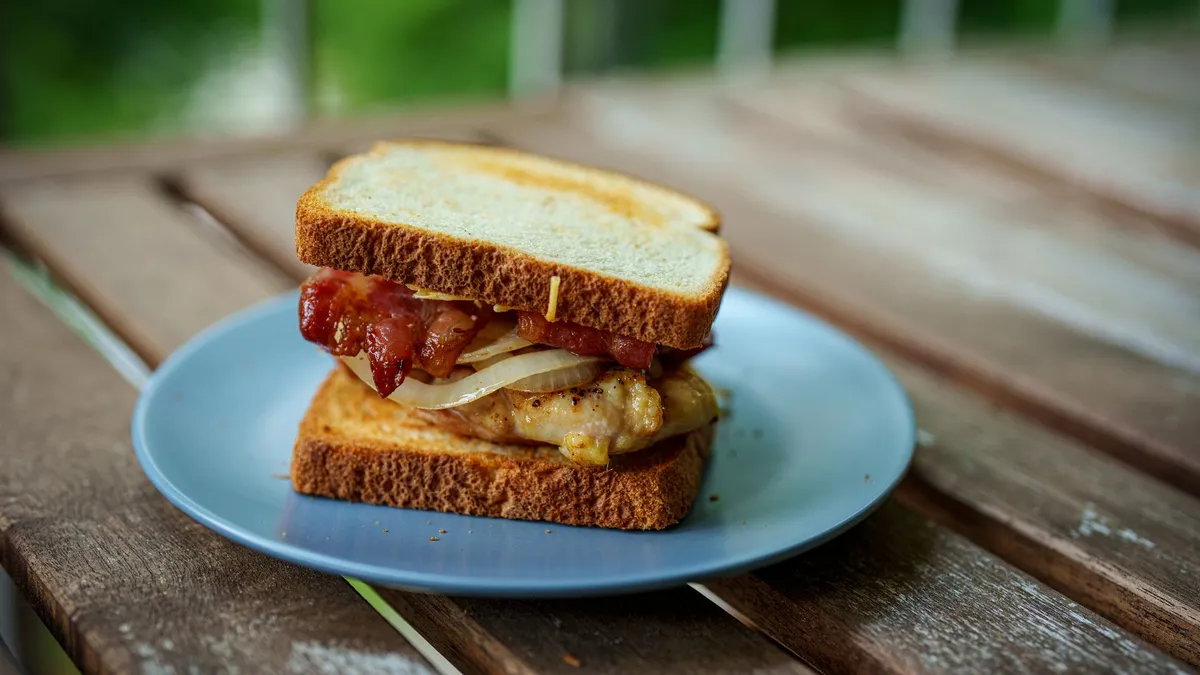
The $9-million box
The per-restaurant economics are where Chick-fil-A stops being ordinary. Across all formats the 2024 average unit volume was about $7.4 million — already extraordinary — but that blends in lower-volume mall units (around $4.5 million). For a standalone, non-mall restaurant the median was about $9.09 million, with an average near $9.3 million. Against McDonald's U.S. average of roughly $3.6 million, a typical Chick-fil-A does well over twice the volume per location — and it does it in six days, because every restaurant closes on Sunday.
That density is the company's real moat. It is why Chick-fil-A sits third in the industry on a fraction of the footprint, and why its drive-thru throughput and labor model are studied across the sector. There are signs the per-unit figure is brushing a ceiling — growth slowed in 2024 — but the absolute level remains unmatched in the category.
A franchise in name, an operator model in substance
Chick-fil-A's "franchise" runs almost backwards from McDonald's, which is why the company keeps so much control. An operator pays just $10,000 to begin — versus the roughly $2 million a McDonald's franchisee fronts. In exchange the operator gets almost no ownership: Chick-fil-A finances and owns the real estate, building, and equipment, then rents the restaurant to the operator (around 15% of sales) and splits the rest, with the operator keeping roughly 50% of pre-tax profit — on a $9 million store, an income often around $200,000–$240,000 (est — derived from the AUV and split, not a disclosed figure). The operator supplies under 10% of the capital; the company supplies the rest.
For fronting everything, Chick-fil-A chooses operators with near-absurd selectivity: of roughly 60,000 applicants a year, about 80 are accepted — a ~0.13% rate, harder than admission to Stanford. Operators run a single restaurant full-time and hands-on; they do not own it, cannot sell it, cannot pass it to their children. The result is a system whose sales run through restaurants the company itself largely owns and tightly controls — closer to a hand-picked operator network than to McDonald's landlord-to-independent-businesses model. It also means Chick-fil-A keeps a larger economic share of system sales than a conventional franchisor — though exactly how much larger is, like the rest of its company accounts, undisclosed.
The growth push — and a first step abroad
Record sales have not slowed the ambition. Domestically Chick-fil-A opened 132 restaurants in 2024 and planned about 183 in 2025, testing new formats — an elevated, multi-lane drive-thru and a walk-up, digital-only model — built around its throughput obsession. And after decades as a U.S.-only brand, it is going global: a roughly $1 billion international commitment through 2025, targeting five markets by 2030, beginning with the United Kingdom (first restaurant in Leeds in early 2025; $100 million over a decade) and Singapore (late 2025; a 10-year, $75 million commitment). For a company that famously moves slowly and on its own terms, this is the most aggressive expansion in its history.
The caliber takeaway
Chick-fil-A is the series' lesson in source tier versus precision — two different axes that are easy to confuse. Its numbers are not estimates; they are source-backed, taken from real franchise filings. What makes them S2 rather than S1 is the authority of the source (an FDD, not an SEC-audited 10-K), not any doubt about whether the figures are genuine. Do not downgrade a sourced FDD figure to "a guess"; do not invent the company-level revenue, profit, or market cap that Chick-fil-A simply does not disclose (there is no public stock to value); and do read its scale as what it is — a tier-S2, FDD-sourced ~$23.9 billion, with ~$9 million per standalone restaurant as the durable, unmatched fact.
It belongs beside Inspire Brands (opens in new tab) as one of this series' private operators — both cases where the right move is to source carefully and respect the edge of disclosure — and stands as the productivity counterpoint to public giants McDonald's (opens in new tab) and Darden (opens in new tab), whose every line you can audit but whose individual restaurants don't come close.
Chick-fil-A — the data card
| Metric | Value | Basis / note | Tier |
|---|---|---|---|
| Scale (2025) | ~$23.9B | Systemwide sales (USD), U.S. — source-backed via FDD | S2 |
| Precision | source-backed (FDD) | private; reported in franchise filings, not SEC-audited | — |
| Restaurants | 3,287 | total network (incl. licensed); 3rd-largest U.S. fast food by sales | S2 |
| AUV — standalone | ~$9.0–9.3M | median non-mall ~$9.09M; all-format avg ~$7.4M (malls lower) | S2 |
| AUV vs McDonald's | ~2.5× | and closed Sundays (6-day weeks) | S2 |
| Operator entry | $10,000 | Chick-fil-A owns real estate + equipment; rents at ~15% of sales | S2 |
| Profit split | operator keeps ~50% pre-tax | operator income ~$200–240k/yr (est — derived from AUV × split, not disclosed) | S2S3est. |
| Operator selectivity | ~80 of ~60,000/yr (~0.13%) | operators don't own / can't sell / can't inherit | S2 |
| International | ~$1B through 2025 · UK (Leeds, early 2025) · Singapore (late 2025) · 5 markets by 2030 | first restaurants outside North America | S2 |
| Domestic openings | 132 (2024) → ~183 (2025 plan) | new formats: elevated drive-thru, digital-only walk-up | S2 |
| Ownership | private (Cathy family) | no market cap — not publicly traded | — |
EstChip appears only on the row tagged est — the derived operator-income figure. Every other row is source-backed (FDD) and carries a TierChip only.
Caliber notes. Chick-fil-A files Franchise Disclosure Documents, not SEC statements, so its system sales and AUV are source-backed at tier S2 (FDD authority is below a 10-K's S1) — not estimates. Scale basis = systemwide sales. The genuinely undisclosed items are company-level revenue/profit/margins and any market capitalization (no public stock) — these are omitted, not estimated. The only estimated figure here is the derived operator income (AUV × split), tagged est. Retrofit reconciliation: scale ~$23.9B matches the locked Chick-fil-A record's 2025 figure of $23.9182B, carried at source_backed precision (FDD-sourced) — this v2 corrects v1's "estimated" framing accordingly. The restaurant count is 3,287 — the locked record's total-network figure including licensed units; this page states the locked number (superseding v1's rounded ~3,000 / the earlier 2,863 outlet figure). No market-cap row — the locked market_cap is null (private, not publicly traded); none fabricated.
Sources. Chick-fil-A FDDs and disclosures for 2024–2025 systemwide sales (~$22.7B 2024 → ~$23.9B 2025) and AUV (~$9M standalone), via Restaurant Business / QSR / Franchise Times / NRN; operator model ($10k entry, ~15% rent, ~50% profit split, ~0.13% acceptance); 2025 international expansion (UK/Leeds, Singapore; ~$1B / 5 markets by 2030); FoodBud locked operator record (markguog/foodservice-listed-operators, 2025 systemwide sales $23.9182B). Cross-references: McDonald's (C1), Inspire Brands (private), Darden (C3).