
Insight
Jun 08, 2026 · 7 min readJapan's biggest restaurant company is a conglomerate — so you size Zensho by its food segments, not its total
Zensho is Japan's largest restaurant company and a vertically integrated conglomerate — so its scale is the foodservice-segment net sales (¥1,140,725m FY2026 ≈ $7.571B screening proxy), not its consolidated total, converted at the FY2026 period-average yen.
Scale basisrestaurant-segment net sales — screening proxy (USD)· FY2026 · estimated (screening proxy)
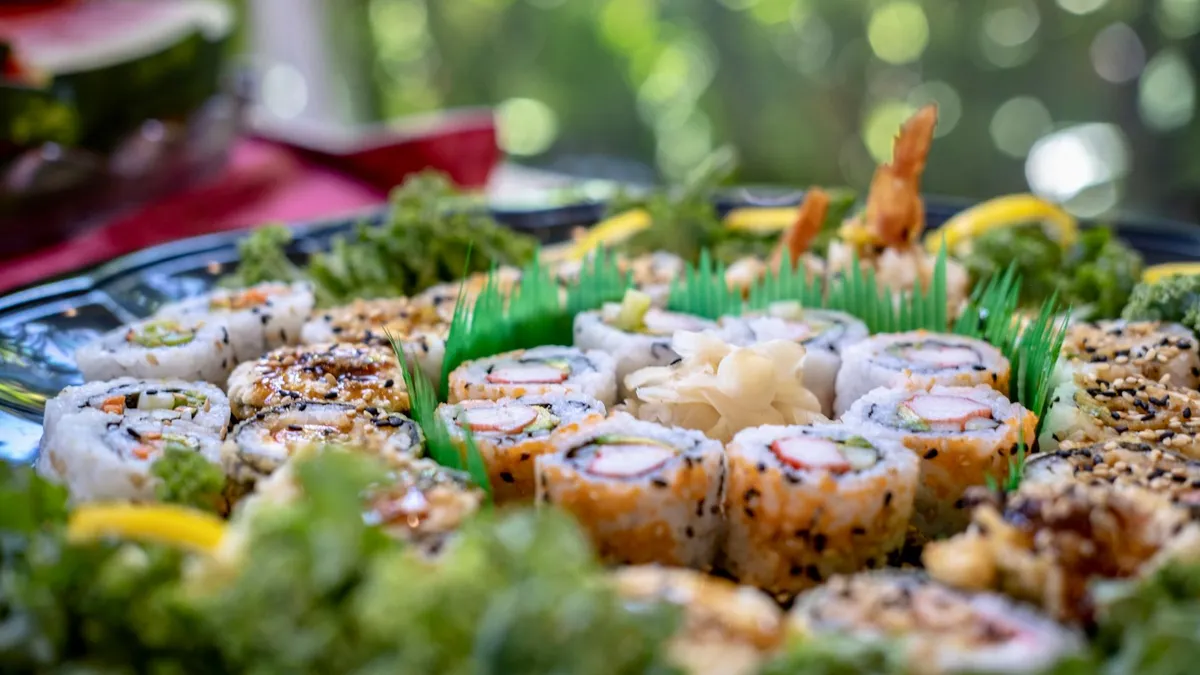
Zensho Holdings is the largest restaurant company in Japan — in FY2025 it became the first Japanese restaurant operator to pass ¥1 trillion in annual sales — and the business behind Sukiya, the country's dominant gyudon (beef-bowl) chain, plus the conveyor-sushi chain Hama Sushi and a long list of others. But Zensho is not only restaurants. It is a vertically integrated conglomerate that also runs supermarkets and other retail. So the most important move in sizing it is the first one: you cannot read its scale off its total, because the total includes businesses that aren't foodservice.
FoodBud's locked scale for Zensho is therefore a segment proxy: the net sales of its restaurant/foodservice segments only — ¥1,140,725 million in FY2026, which converts to about $7.571 billion. We label it a screening proxy, mark it estimated, and show the yen first — because two separate disciplines stand between Zensho's filings and a number you can put on a leaderboard.
Discipline one: size the segments, not the conglomerate
Zensho reports in segments, and only some of them are restaurants. The locked scale sums the five foodservice segments and deliberately leaves out the rest:
| Segment (FY2026) | Net sales (¥m) |
|---|---|
| Global Sukiya | 314,454 |
| Global Hamasushi | 320,277 |
| Global Prepared Food | 221,895 |
| Global Fast Food | 112,818 |
| Restaurants | 171,281 |
| Foodservice total (= scale) | 1,140,725 |
| Excluded — Retail | 76,032 |
| Excluded — Corporate & Support | 4,887 |
| Excluded — Other | 41,300 |
Foodservice is the large majority of Zensho, but it is not all of it. Including the supermarket (Retail) revenue, or the corporate line, would inflate the "restaurant" scale with sales that have nothing to do with running restaurants. So FoodBud counts Sukiya, Hama Sushi, Prepared Food, Fast Food, and Restaurants — and excludes Retail, Corporate, and Other. Size the segments that match the question, not the conglomerate total.
Discipline two: convert at the period-average yen, not the spot rate
Zensho reports in yen, so a dollar figure is a conversion — and conversions are where comparability quietly breaks. FoodBud converts the ¥1,140,725 million at the fiscal-year period-average exchange rate, not whatever the yen happens to be trading at today: 150.66772 JPY/USD, the FY2026 average (April 2025–March 2026) from the U.S. Federal Reserve's DEXJPUS series. That yields $7.571 billion (¥1,140,725m ÷ 150.66772). Use the spot rate, or last year's average, and the same yen figure would screen as a materially different dollar number — which is exactly how a currency move gets mistaken for a change in the business. The rate, its period, and its source are all recorded with the figure.
Why it's a proxy, and marked "est."
Even after both disciplines, the result is a screening estimate, not a hard basis — and FoodBud says so. The segment net-sales figure blends company-operated store sales with franchise-related revenue (Zensho runs roughly 8,235 franchised outlets, concentrated in the Fast Food segment, which includes Lotteria), so it is neither pure company-operated revenue nor a literal system-wide-sales total. It is a reasonable stand-in for operational scale — good enough to rank Zensho against its peers on a screening basis — but it carries an estimated precision and an "est." suffix, and it should be read as such, not as an audited apples-to-apples line.
The brands and the machine
Underneath the segments is a genuinely vast operation: roughly 14,947 outlets in FY2026 (including the ~8,235 franchises). Sukiya is the flagship — Japan's leading gyudon chain — alongside Hama Sushi, and then a deep bench: Nakau, Coco's, Big Boy, Jolly Pasta, Lotteria (acquired 2023), and more, with Retail (supermarkets) rounding out the group. Zensho's edge is vertical integration: it controls procurement, processing, and distribution end to end, which is how it sustains low prices at scale. And it has gone aggressively global — the 2023 acquisitions of Snowfox/YO! Sushi (grab-and-go sushi across the U.S. and U.K.), Sushi Circle in Germany, and Lotteria pushed it well beyond Japan, with Sukiya itself operating in China, Taiwan, Thailand, and Brazil.
That scale also concentrates risk. In early 2025 Sukiya was hit by two foreign-object incidents — a mouse found in miso soup, then a cockroach — and took the extraordinary step of closing nearly all of its ~1,970 Japanese restaurants for several days (late March into April) for top-to-bottom pest control. The brand absorbed a real hit and a costly closure, then recovered — a reminder that in a company-dense, vertically integrated operator, a food-safety shock lands directly on the company's own restaurants.
The caliber takeaway
Zensho is this series' lesson in segment proxy plus foreign exchange — two disciplines most chain comparisons skip. Its scale is the foodservice-segment net sales (¥1,140,725m), not the conglomerate's total (which carries retail and corporate), and not a pure company-operated or system-sales basis (the segments include franchise revenue). Convert at the period-average yen (150.66772, FY2026, FRED), and the number is $7.571 billion — a screening estimate, flagged "est.," shown yen-first. Do not size Zensho off its consolidated total, do not convert at the spot rate, do not read the proxy as an audited like-for-like basis, and do not rank by the ~$7.7 billion market capitalization. Sized correctly, the largest restaurant company in Japan is a ¥1.14-trillion foodservice business — counted by the right segments, in the right yen.
It shares its "estimated, read-it-as-a-proxy" character with the private operators Chick-fil-A (opens in new tab) and Inspire (opens in new tab), and its FX discipline applies to every non-USD operator FoodBud tracks — the next of which, Jollibee (opens in new tab), will put the same period-average-rate rule to work on the Philippine peso.
Zensho Holdings (TSE: 7550) — the data card
| Metric | Value | Basis / note | Tier |
|---|---|---|---|
| Scale (FY2026) | $7.571B (est.) | restaurant-segment net sales — screening proxy; ¥1,140,725m ÷ 150.66772 | S1est. |
| — Global Sukiya | ¥314,454m | gyudon flagship | S1 |
| — Global Hamasushi | ¥320,277m | conveyor sushi | S1 |
| — Global Prepared Food | ¥221,895m | prepared / packaged foodservice | S1 |
| — Global Fast Food | ¥112,818m | incl. Lotteria; most of the franchises | S1 |
| — Restaurants | ¥171,281m | Nakau, Coco's, Big Boy, Jolly Pasta… | S1 |
| Excluded from scale | Retail ¥76,032m · Corporate ¥4,887m · Other ¥41,300m | not foodservice | S1 |
| FX | ÷ 150.66772 JPY/USD | FY2026 period-average (FRED DEXJPUS, Apr 2025–Mar 2026), not spot | S1 |
| Outlets (FY2026) | ~14,947 | incl. ~8,235 franchises (mostly Fast Food / Lotteria) | S1 |
| Scale per outlet | ~$0.51M (est.) | proxy ÷ outlets; mixed denominator (stores/franchises) — screening only | est. |
| Precision | estimated ("est.") | screening proxy; yen converted | — |
| Market capitalization | $7.729B (2026-05-22) | ⛔ do not use as scale — valuation only | S1 |
Caliber notes. Scale basis = restaurant/foodservice segment net sales as a screening proxy (bucketed under system-sales for cross-operator screening, flagged screening_proxy + estimated). It is not total consolidated revenue (Retail/Corporate/Other are excluded) and not pure company-operated revenue (the segments include franchise sales; ~8,235 franchises). FX: JPY reporter → converted at the FY2026 period-average rate 150.66772 (FRED DEXJPUS, Apr 2025–Mar 2026), recorded with the figure — never a spot rate. The USD scale and per-outlet figures are estimates (proxy + conversion) → "est."; the underlying JPY segment figures are source-backed (FY2026 results, S1). Per-outlet denominator mixes stores/franchises — screening only. All figures FY2026 (FY2025 store count 15,419 retained as historical raw). Market cap fenced from all scale comparisons. Retrofit reconciliation: matches the corrected locked record — scale $7.571B (¥1,140,725m ÷ 150.66772), outlets 14,947 (incl 8,235 franchises), precision estimated, market cap $7.729B, all FY2026 vintage — zero divergence; keep the existing slug.
Sources. Zensho FY2026 consolidated results (segment net-sales table; ¥1,140,725m foodservice; ~14,947 outlets / ~8,235 franchises) — Zensho IR (EN, 12 May 2026); FX = FRED DEXJPUS FY2026 period-average (150.66772, Apr 2025–Mar 2026); 2025 Sukiya foreign-object closures and 2023 Snowfox/YO! Sushi, Lotteria, Sushi Circle acquisitions via industry coverage; FoodBud locked operator record (markguog/foodservice-listed-operators, listed-jpx-tse-7550-zensho-holdings-co-ltd). Cross-references: Chick-fil-A, Inspire, Jollibee (next).